Reframing Poverty Within the Sustainable Development Strategies. Empirical Evidence at the European Union Level
Abstract:
(1) Purpose: Within the significance of eradicating poverty in the long term, the purpose of this paper is to assess the implications of the dimensions of sustainable development, across all European Union Member States, on poverty, through the lens of dimensions focused on economic and social factors, both directly and globally, in their mutual interconnectedness. (2) Methodology: The research methodology consists of applying two econometric models, namely, panel models (with fixed effects) and Gaussian graphical models, to assess the mutual, global interconnectedness of the main sustainable development benchmarks. Data used in the analysis was collected for the period 2009 and 2019. (3) Results: There are direct and overall implications of the dimensions of sustainable development (including economic and social factors), across all European Union Member States, on poverty. (4) Conclusions: All the European Union Member States are affected by poverty, but to varying degrees, which is why governments are urged to further develop actions to combat the harmful effects of poverty. (5) Implications: In the context of the current financial and geopolitical crisis driven by Russia’s invasion of Ukraine, increasing the focus of all stakeholders on poverty and sustainable development is essential, especially by expanding sustainable development goals that address multi-dimensional poverty.
1. Introduction
Economic and social development goals are defined in terms of sustainability in all developed and developing countries. The interpretations attributed to sustainable development may vary, but all countries share certain general features of sustainable development, outlined by the 17 targets set by the United Nations 2030 Agenda (United Nations, 2015). Although the 17 goals are underpinned by targets and indicators, known as “Sustainable Development Goals (SDGs)”, all the goals are closely interlinked, and failure to meet them as a whole will perpetuate an unbalanced approach to them. The 17 SDGs encompass all three dimensions covered by sustainable development: social inclusion, economic growth and environmental protection. Some of these goals address the root causes of poverty and the universal need for development that removes inequalities between people.
The importance of eradicating poverty in the long term has also been recognised by the award of the Nobel Prize in Economics in 2019 for research in this area of debate. It was jointly awarded to Abhijit Banerjee, Esther Duflo and Michael Kremer for their experimental approach to combating global poverty in relation to health, education and technology (Ovchinnikov, 2020). Furthermore, in terms of sustainable economic development, in 2018, the Nobel Prize in Economics was awarded to Americans William D. Nordhaus and Paul M. Romer, for their work on sustainable economic growth by building models that explain how the market economy interacts with nature and knowledge (Nobelprize, 2018).
Within these foundations, the research objective of this paper is to assess the implications of the dimensions of sustainable development, across all European Union (EU-27) Member States, on poverty (through the lens of dimensions focused on education, health, income), both directly and globally, in their mutual interconnectedness. The research methodology consists of applying two econometric models, namely: (i) fixed effects models (FE), of panel type, to assess the direct implications of the sustainable development dimensions on poverty at the EU-27 level; (ii) Gaussian graphical models (GGM) to assess the mutual, global interconnectedness of the main sustainable development benchmarks. Data used in the analysis was collected for the period 2009 and 2019, subject to availability on European Commission (2021).
After a brief introduction on the importance of the researched topic, the paper includes a literature review on poverty and its interconnections with factors affecting sustainable development. The data used, the research methodology and the hypotheses drawn to be evaluated are then presented. The results are accompanied by discussions, and the paper concludes with the main strategies proposed in the conclusion section. A series of tables and figures inserted in the Appendix support the research approaches taken.
2. Literature Review
The literature shows that poverty implicitly affects the physical and mental health of poor people (Patel et al., 2020; Ridley et al., 2020; OECD Publications, pp. 92-92, 2003), and poor health can make it difficult for people to carry out their usual, everyday activities (Allen & Balfour, 2014). In addition, poverty and poor health can reduce a person’s ability to participate in the labour market, social life and maintain good living conditions (Pega et al., 2022). Poverty is the inability to achieve certain standards, basic, economic and social, so that poor people experience a lack of adequate food, shelter, education, health care and poor service by state institutions and society (Wolfensohn & Bourguignon, 2004).
Poverty reduction is one of the most important sustainable development priorities of both developing and developed countries (Koehler, 2017; Padda & Hameed, 2018). Progress in achieving the poverty target can be achieved directly by stimulating economic growth (Cristea et al., 2021; Le Caous & Huarng, 2020; Mansi et al., 2020; Peng & Lu, 2020). The implications of poverty, correlated with education, health, environment or sustainable cities have been intensively debated in the literature (Cristea et al., 2021; Patel et al., 2020; Pega et al., 2022; Ridley et al., 2020; Salvia et al., 2019), and it is highlighted that there are considerable differences between regions and countries, depending on the priorities given.
People’s low participation in education and lack of vocational qualifications lead to poverty and insecurity (Cristea et al., 2021), which can further lead to a considerable shortage of jobs due to skills and qualification problems. Lack of literacy skills can make it difficult to access different services (e.g. filling in forms, understanding complex rules and instructions). As such, there is a directly proportional relationship between the educational attainment and poverty reduction through increased population income, as demonstrated by Mansi et al. (2020).
With the onset of the Covid-19 pandemic in 2020, the short-term economic and welfare costs have been severe. As Covid-19 spread to the poorest areas of the EU, in addition to increased mortality rates, its economic and social consequences caused more people to become poor (Laborde et al., 2020; Mukarram, 2020).
Poverty reduction is therefore primarily influenced by countries’ economic growth, but also by education, health and income levels.
3. Data and Methodology
Acronym | Description | Measuring unit |
pib_cap_loc | GDP per capita, which represents a nation’s productive potential on a per capita basis | Euro per capita |
er_20_64 | Employment rate, 20-64 years old | % of total population |
gerd | Gross domestic expenditure on R&D | % of GDP |
edu_att | Population included in a level of education | % of population 15-64 years old |
earn | Annual net wage income for a couple with two children, where both adults earn 100% of the average net income | Euro |
le | Life expectancy at birth | years |
saracie | People at risk of poverty and social exclusion (poverty rate) | % of the total population |
sanatate_65_f | Healthy life years after 65 - women | years |
sanatate_65_m | Healthy life years after 65 - men | years |
sdg_03_20 | Share of people with perceived good or very good health | % of population aged 16 and over |
The variables used in the analysis (Table 1) comprise the following groups of indicators:
• sustainable development indicators with economic impact: Gross Domestic Product (GDP) per capita (pib_cap_loc), employment rate (20-64 years) (er_20_64), gross domestic expenditure on research and development (R&D) (gerd), annual net wage income for a couple with two children where both adults earn 100% of the average net income (earn);
• indicators of sustainable development with social impact: life expectancy at birth (le), population by level of education (edu_att), people at risk of poverty and social exclusion (saracie), healthy life years after 65 for women (sanatate_65_f) and men (sanatate_65_m) respectively, share of people with good or very good perceived health (sdg_03_20).
Data used in the analysis was collected for the period 2009 and 2019, subject to availability on European Commission (2021).
Table 2 contains the statistical indicators used to evaluate the variables included in the chosen econometric models. As can be seen from the analysis of the skewness and kurtosis tests, we have instances of variables with positive and negative symmetry, as well as instances of variables with a leptokurtic distribution.
Variables | Obs | Mean | Standard deviation | Minimum | Maximum | Skewness | Kurtosis |
saracie | 11 | 23.52 | 1.30 | 20.9 | 24.9 | -0.96 | 2.63 |
pib_cap_loc | 11 | 25939.09 | 1205.15 | 24400 | 28050 | 0.56 | 1.98 |
er_20_64 | 11 | 69.43 | 2.04 | 67.5 | 73.2 | 0.78 | 2.08 |
gerd | 11 | 2.09 | 0.07 | 1.97 | 2.2 | -0.46 | 2.08 |
edu_att | 11 | 71.29 | 2.18 | 67.6 | 74.3 | -0.34 | 1.97 |
sanatate_65_f | 11 | 9.01 | 0.92 | 8 | 10.4 | 0.32 | 1.35 |
sanatate_65_m | 11 | 8.90 | 0.81 | 8 | 10.2 | 0.33 | 1.44 |
sdg_03_20 | 11 | 67.48 | 0.86 | 66.5 | 69 | 0.64 | 1.99 |
le | 11 | 80.5 | 0.55 | 79.5 | 81.3 | -0.40 | 2.14 |
earn | 11 | 46534.4 | 1804.69 | 45190.2 | 50432.2 | 1.12 | 2.96 |
The research methodology consists of applying two econometric models: (i) panel econometric models; (ii) Gaussian graphical models.
Panel econometric models are chosen according to the structure of the data, which determines the estimation method applied. Panel econometric models assess the direct implications of the selected independent variables (sustainable development dimensions, in our research) on dependent variable (poverty). Thus, for balanced panel data the application of models with fixed effects (FE) is indicated, and for complete data structures, the application of models with random effects (RE) is indicated (Bugudui, 2015).
As “multilevel modeling” underpinnings literature highlight, FE models are estimated “using least squares” or “maximum likelihood”, while RE models are estimated “with shrinkage”/“linear unbiased prediction” (Robinson, 1991). FE models are “constant across individuals”, while RE models “vary”.
Panel models with fixed effects are estimated using Eq. (1) (Brüderl & Ludwig, 2014):
where,
$y_{i t}$ – represents the observed result;
$x_{i t}$ – represents the covariance vector;
β – is the vector of parameters to be estimated;
$e_{i t}$ – represents the error term.
GGMs are tools applied in research to infer interdependencies between variables (Altenbuchinger et al., 2020). GGMs assess the overall/global interlinkages among variables, namely the selected indicators of the sustainable development benchmarks, including poverty. GGM is a graph built by “nodes”, given by the interconnections of all variables, two by two, randomly connected using “a multivariate Gaussian distribution” (Roverato, 2017). GGM identifies the intensity between the variables (given by the lines thickness), but also the influence between them (a positive influence is given by blue color, and the negative one, by the red one).
GGMs can be estimated using the partial correlation method, which in turn takes the form of a correlation between two variables corrected for the influences of the other variables included in the system of equations, allowing to distinguish direct from indirect effects (Roverato, 2017). GGMs provide a framework for estimating partial correlations by measuring conditional dependencies between variables, offering the possibility to visualize the results as a network of nodes representing variables and dependencies between variables as edges (Roverato, 2017).
Research hypotheses:
H1. There are significant direct influences of representative indicators of sustainable development on the poverty rate, in terms of poverty reduction, in the EU-27 Member States;
H2. Significant interlinkages exist between poverty and representative indicators of sustainable development at EU-27 Member States level.
4. Results and Discussions
The explanatory power of the variation in representative social and economic indicators on people at risk of poverty and social exclusion can be estimated using a panel regression model.
A first step in estimating the panel model is to generate the correlation matrix (Figure 1) for all the variables included in the model, which allows visual analysis of the relationship between variables, as well as the detection of missing data points and outlier variables.

The next step in choosing the right model was the model estimation of a standard regression, where Prob>F=0.000 was less than the 5% critical threshold, indicating the possibility of analysis using panel models. In order to determine normality within the variables, we applied the Jarque-Berra test, with a chi2=0.009 being greater than the 5% critical range, signaling lack of normality.
The next test applied concerns the existence of multicollinearity between variables, where, after application, values greater than 10 were observed for the VIF test, indicating the existence of independent correlations between log_pib_cap_loc, log_earn, sanatate_65_f and sanatate_65_m, but lack of multicollinearity at the test level. These results are to be expected as there is a strong correlation between economic variables, but also between social variables. The last test assesses the existence of heteroskedasticity by applying the White test, confirming the H0 hypothesis of the existence of homoskedasticity (p-value>5%). The specific steps and processes of White test are: (1) estimating the model by applying the Ordinary Least Squares (OLS), obtaining the Y value - in our case, Y is people at risk of poverty and social exclusion (saracie) - Eq. (1); (2) maintaining the R-squared and determining F-statistic (F-test). F-test is 31.072, with p<0.000. The variables representing sustainable development can explain the variation in the dependent variable (people at risk of poverty and social exclusion) at R2=44.8%.
Variables | Coef. | St. Err. | t-value | p-value | [95% Conf. | Interval | Sig. | |||
er_20_64 | -0.493 | 0.048 | -10.18 | 0.000 | -0.588 | -0.398 | *** | |||
log_gdp_cap_loc | 0.000 | 0.000 | -3.02 | 0.003 | 0.000 | 0.000 | *** | |||
gerd | -0.905 | 0.622 | -1.45 | 0.147 | -2.128 | 0.319 |
| |||
edu_att | 0.147 | 0.049 | 3.00 | 0.003 | 0.051 | 0.244 | *** | |||
log_earn | 0.000 | 0.000 | 2.44 | 0.015 | 0.000 | 0.000 | ** | |||
sanatate_65_f | -0.066 | 0.272 | -0.24 | 0.808 | -0.601 | 0.469 |
| |||
sanatate_65_m | 0.568 | 0.324 | 1.75 | 0.080 | -0.069 | 1.204 | * | |||
sdg_03_20 | -0.18 | 0.057 | -3.15 | 0.002 | -0.292 | -0.068 | *** | |||
le | -0.856 | 0.228 | -3.76 | 0.000 | -1.304 | -0.408 | *** | |||
Constant | 126.786 | 15.181 | 8.35 | 0.000 | 96.927 | 156.646 | *** | |||
| ||||||||||
Mean dependent var: | 23.852 | SD dependent var: | 7.538 | |||||||
R-squared: | 0.448 | Number of obs.: | 380 | |||||||
F-test: | 31.072 | Prob > F: | 0.000 | |||||||
Akaike crit. (AIC): | 1698.569 | Bayesian crit. (BIC): | 1737.971 | |||||||
Note: *** p<0.001 ** p<0.05 * p<0.1 Source: authors’ contribution based on Stata 17 | ||||||||||
The last part in the estimation of the final panel model consisted of estimating a FE (“Fixed Effects”) and RE (“Random effects”) panel model and estimating the Hausman test to determine the superior model. The final model is the FE model (p-value>5%) and is shown in Table 3.
In the panel model, the dependent variable (poverty) is positively affected by the employment rate (er_20_64), the share of people with perceived good or very good health (sdg_03_20) and life expectancy at birth (le), negative results (which attracts poverty reduction) and statistically significant with p-value<0.001. The dependent variable, people at risk of poverty and social exclusion (saracie), is unfavorably influenced by population by education level (edu_att) and healthy life years in absolute terms from age 65 for men (sanatate_65_m), the results being positive (which attracts poverty increase) and statistically significant (with p-value<0.001, respectively 0.1).
Therefore, research hypothesis 1, H1. There are significant direct influences of representative indicators of sustainable development on the poverty rate, in terms of poverty reduction, in the EU-27 Member States, is partially fulfilled.
The Gaussian graphical model (GGM), estimated in Figure 2, is based on partial correlation (PCOR) method, in identifying the intensity between variables and their influence. For the estimated GGM, measures of centrality as well as measures of clustering at the variable level were calculated and presented in tabular (Table A1 and Table A2 in the Appendix) as well as visual (Figure A1 and Figure A2 in the Appendix) format.
In the GGM, GDP per capita (gdp_cap_loc) and annual net wage income for a couple with two children (earn) were logarithmed to bring variance and scale to a common denominator, and these variables were renamed representative log_pib_cap_loc, respectively, log_earn. We apply logarithmic procedure to transform these variables, highly skewed, into a normalized dataset, in order to “produce the smallest error possible when making a prediction, while also taking into account that we should not be overfitting the model” (Bugudui, 2015).
In the estimated GGM a high favourable influence on people at risk of poverty and social exclusion (saracie) can be observed from the employment rate, 20-64 years (er_20_64), as well as a number of unfavourable influences of low intensity from life expectancy at birth (le) and gross domestic expenditure on research and development (gerd).
The employment rate, 20-64 years (er_20_64), is favorably influenced by the share of people with good or very good perceived health (sdg_03_20), healthy life years after 65 for men (sanatate_65_m), annual net wage income for a couple with two children (log_earn), and with low intensity by healthy life years after 65 for women (sanatate_65_f).
It is interesting to note the negative link between the share of people with perceived good or very good health (sdg_03_20) and GDP per capita (log_pib_cap_loc), as well as the strong favorable links between life expectancy at birth (le), population by educational attainment (edu_att) and gross domestic expenditure on research and development (gerd).
Thus, research hypothesis 2, H2. There are significant interlinkages between poverty and the indicators representing sustainable development at EU-27 Member States level, is fulfilled.
5. Conclusions
Given the findings of this paper, in the context of the current financial and geopolitical crisis driven by Russia’s invasion of Ukraine, increasing the focus of all stakeholders on poverty and sustainable development is essential, especially by expanding sustainable development goals that address multi-dimensional poverty. All the EU Member States are affected by poverty, but to varying degrees, which is why governments are urged to further develop actions to combat the harmful effects of poverty.
In this respect, based on the research objective outlined and the research hypotheses tested, at EU-27 level, we propose the following solutions/strategies for improving the quality of life of people at risk of poverty and social exclusion at EU-27 level, as follows: developing and implementing policies and programmes for rapid and sustained economic growth in areas such as health, education and nutrition, enabling the poor to participate and contribute to economic growth; developing rental assistance for low-income families, as these families often face homelessness or housing instability; creating affordable housing, as many people pay more than one-third to one-half of their income on rent, instalments and utilities; creating well-paid jobs that meet people’s needs; raising the minimum wage to significantly improve living standards for millions of people; supporting pay equity between different sectors of activity to create a fair labour market; giving poor people access to basic social services, for education, health care, adequate food, sanitation, shelter.
One of the limitations of the research is the limited availability of data over longer time series. Future research will focus on a broader range of economic and social indicators to measure and assess the level of economic and social inclusion of the poor, to identify progress or delays in the fight against poverty and to achieve smart, sustainable and inclusive growth, as well as analysis by groups of countries, i.e. developed and developing countries.
All authors equally contributed to the article, and they have read and agreed to the published version of the manuscript.
The data used to support the research findings are available from the corresponding author upon request.
The authors declare no conflict of interest.
Table A1. Evaluation of centrality measures on variables within the GGM (2009-2019)
| Variables | Network | |||
| Betweenness | Closeness | Strength | Expected influence | |
| saracie | -0.592 | 0.242 | -0.805 | -2.148 |
| er_20_64 | 0.125 | 0.496 | 1.652 | -1.063 |
| gerd | -0.950 | -1.447 | -0.747 | 0.234 |
| edu_att | 1.201 | -0.803 | 1.205 | 1.095 |
| sanatate_65_f | 0.484 | 1.252 | 0.963 | 0.989 |
| sanatate_65_m | 2.097 | 1.785 | 0.588 | 0.823 |
| sdg_03_20 | -0.592 | -0.392 | -0.653 | -0.186 |
| le | -0.592 | -1.008 | -0.293 | 0.434 |
| log_pib_cap_loc | -0.950 | -0.168 | -0.962 | -0.322 |
| log_earn | -0.233 | 0.044 | -0.948 | 0.145 |
Source: Authors’ contribution based on analysis in R
Table A2. Evaluation of grouping measures by variables within the GGM model (2009-2019)
| Variables | Network | |||
| Barrat | Onnela | WS | Zhang | |
| saracie | -0.185 | -0.275 | -0.402 | 0.678 |
| er_20_64 | 0.150 | -0.134 | -0.402 | 0.834 |
| gerd | 0.371 | 0.905 | 0.689 | -0.535 |
| edu_att | 0.231 | -0.538 | 0.689 | -0.898 |
| sanatate_65_f | -1.537 | -1.111 | -1.182 | -0.878 |
| sanatate_65_m | 0.574 | 1.842 | 0.689 | 2.295 |
| sdg_03_20 | -1.147 | -0.916 | -0.621 | -0.255 |
| le | 0.257 | -0.146 | 0.253 | -0.331 |
| log_pib_cap_loc | 2.031 | 1.246 | 1.781 | -0.203 |
| log_earn | -0.744 | -0.872 | -1.494 | -0.707 |
Source: Authors’ contribution based on analysis in R
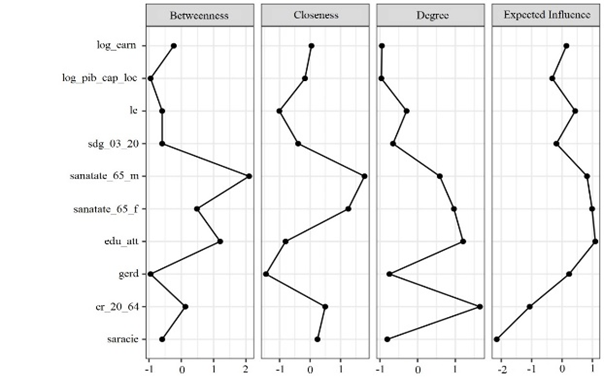
Figure A1. Graphic representation for centrality measures within the GGM (2009-2019)
Source: Authors’ contribution based on analysis in R
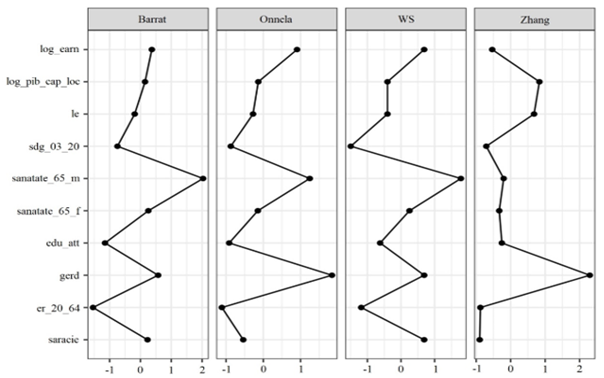
Figure A2. Graphic representation for clustering measures within the GGM (2009-2019)
Source: Authors’ contribution based on analysis in R