Perception of Large Danger Lists and Orange Boards for Marking Transport Units
Abstract:
Transport of goods in a city is a basic prerequisite for meeting the needs of the population. The transport of dangerous goods, especially in urban areas, represents a risk that can result in a dangerous situation as well as unwanted consequences. According to the data, the percentage of dangerous goods transported in the European Union is 4% of the total amount of transported goods. The perception of road users is one of the basic factors for the safe and smooth flow of traffic. Bearing the above in mind, this paper conducted an analysis aimed at determining the differences in the perception of large danger lists and orange boards for marking transport units. 288 respondents participated in the research. The results show that there are statistically significant differences between the perception of large danger lists and orange boards for marking transport units, viewed according to gender, age, place of residence, education, occupation of the respondents and according to the driver's license category.
1. Introduction
The transport of dangerous goods is a global problem that has attracted more and more attention over the years, primarily due to the increased number of substances that are classified as dangerous goods, but also because of the challenges in their transport organization [1], [2], [3].
Dangerous goods are substances that, due to their properties (toxicity, radiation hazard, explosiveness, flammability, corrosiveness) or chemical reactions during production, transport, storage, transshipment and use, can endanger the health and life of people, pollute the environment or cause damage to material goods [3]. The largest number of accidents with dangerous goods occur in the production process 40%, during transportation 35% and during storage 25% [3], [4]. Therefore, bearing the above in mind, it can be concluded that managing the risk of a dangerous situation can play a major role in preventing the occurrence of unwanted consequences [3], [4], [5].
There is no complete protection against dangerous goods [3], [6]. This would be possible only if dangerous goods were not produced, used and transported. Nowadays, the use of dangerous goods is necessary. Therefore, the risk of harmful effects of dangerous goods on the health of living beings and the preservation of natural resources and material goods should be reduced to the smallest possible extent by appropriate measures. In addition to the risk during transportation, the risk during loading and unloading of dangerous goods cannot be avoided. Risk quantification was carried out through: the probability of an accident event, a set of potentially endangered objects, which depend on the characteristics of the dangerous good itself, the amount of substance transported in the means of transport and the characteristics of the environment in which the accident occurred; intensity of endangerment, i.e., the number of objects affected by the effects of dangerous goods and the form and scope of preventive activities. For the field of transportation of dangerous goods, a scientific and analytical assessment of the risk, its level of spread and assessment of the consequences on people, nature and objects is necessary [2], [3], [6].
The risk associated with the transportation of dangerous goods, according to the author [3] does not depend only on the substances found in the vehicle, but also on other characteristics related to: types of roads, natural environment, weather conditions, skills and professional qualifications of the drivers, population along the selected routes etc. The risk associated with the transportation of dangerous goods is associated with the possibility of an accident with negative environmental and health consequences, which cannot be avoided, because there will always be a need for the production, transportation, storage, handling and use of dangerous goods. Therefore, in the event of an accident with dangerous goods, the road infrastructure can be damaged, the environment can be polluted, but also the life and health of people can be endangered [3]. The transport of dangerous goods by road creates a risk for people who are present on the road (users) and people along the roads (residents) [3]. Bearing the above in mind, it is necessary to have information about the frequency and consequences of accidents with dangerous goods. The frequency and impacts depend on: the consequences of the accident and their duration, the category and danger of the goods, the type of unwanted event, the type of road, the environment of the area, the structure of the road and other factors [3]. Reducing the potential negative impacts during logistics activities with dangerous goods is an important task for the local community, competent authorities, manufacturers, transporters and other interested parties [3].
Risk prevention in individual logistics subsystems for dangerous goods is a permanent topic of research from production logistics, warehouse logistics, transport logistics and other logistics activities [3]. In recent years, a large number of researchers have dealt with the issue of risk assessment in the transport of dangerous goods [3]. The transport of dangerous goods in road traffic is focused on three topics: methodologies for improving response in emergency situations based on the characteristics of roads, weather conditions and traffic factors, methodologies for research and analysis of the risk of accidents from data in order to eliminate the characteristics of accidents such as the frequency of occurrence, consequences and identification of causal factors and decision-making in order to improve the selection of appropriate routes for the movement of vehicles with dangerous goods [3]. In road traffic, risk analysis concepts for different types of transportation of dangerous goods are predominantly based on route planning [7], [8], [9] and driver training [6].
Maslać with associates [10] in their research observed that the age of participants, years of driving experience, and classes of dangerous goods are associated with risky behavior of drivers during the transport of dangerous goods. Older drivers make more omissions than younger drivers, but also make fewer mistakes. Drivers with less driving experience are prone to making more mistakes than drivers with more driving experience. In comparing drivers involved in the transportation of hazardous materials across different classes, it was observed that those handling Class 4 dangerous goods (flammable solids) exhibited the least aberrant behavior while driving. On the other hand, drivers responsible for transporting Class 2 and 3 goods, which are most commonly encountered on roads (including gases and petroleum products), showed variations in both lapses and positive behaviors. Notably, drivers dealing with Class 9 goods (other dangerous substances) demonstrated the highest frequency of aberrant behaviors, including both ordinary and aggressive violations. Class 9 substances encompass hazardous materials not classified within the primary Class 8 category, thus posing a relatively lower risk to the environment [10], [11].
There is a very limited number of studies that have dealt with the perception of large danger lists and orange boards for marking transport units. Bearing in mind all of the above, the aim of this research is to collect empirical data with the aim of determining whether there are differences in the perception of large danger lists and orange boards for marking transport units.
2. Methodology
The research was conducted using a survey created on the google forms platform [12]. The survey consisted of 17 questions, closed type, of which the first group of questions was aimed at collecting the respondents' demographic data (gender, age, place of residence, education, occupation), the second group of questions was related to examining the characteristics of the respondents related to participation in traffic (characteristics of traffic participants, possession of a driver's license, category of driver's license), while the third group of questions related to the examination of the perception of large danger lists and orange plates for marking vehicles. The internal consensus analysis of the questionnaire was conducted using the Cronbach’s alpha coefficient, yielding a result of 0.749, indicating satisfactory internal consistency of measurements. This value confirms the reliability of the questionnaire in measuring participants’ perceptions regarding large danger lists and orange boards for marking transport units. These findings contribute to the validity of the research by providing insights into the consistency of respondents’ answers and the reliability of measuring relevant constructs.
The research was conducted during the last three months of 2023 year. The study involved 288 participants. The participants consisted of truck drivers and transportation managers in companies, all in their first year of employment. The sample size is in line with other similar studies conducted on a driving simulator [10], [11]. Respondents did not receive any compensation for participating in the research [13].
Data from the survey was downloaded into the database created in the MS Excel 2023 software package [12]. Statistical data processing was performed using the statistical program SPSS Statistic v.23, where standard methods of descriptive and analytical statistics were used during the processing.
Normality of distribution was tested by inspection of histograms and the Kolmogorov-Smirnov test. Since the data for all measured variables distribution were normally distributed, we used parametric methods. To assess the significance of differences the Independent Samples T-Test and One-way ANOVA were used [14], [15]. The Tukey post hoc test was used for the additional comparison between groups [16].
The null hypothesis (H0) was: There are no statistically significant differences between the groups. The alternative hypotheses (Ha) were: There are statistically significant differences between the groups. The threshold for the statistical significance (a) was set to 5%. Consequently, if probability (p) is smaller or equal to 0.05, H0 is rejected, and Ha is accepted. On the contrary, if p $>$ 0.05, H0 is not rejected.
3. Results
288 respondents participated in the research. The share of male respondents in the sample was 40.3%, while the share of female respondents was 59.7%. Almost half of the respondents (48.6%) were young road users aged 18-25 years, 22.9% respondents aged 26-35 years and 13.2% respondents aged 36-45 years. The highest percentage of respondents, 50%, had completed high school, 24.3% had basic professional studies, while 11.8% of respondents had completed basic academic studies. 43.1% of respondents were employed, 36.1% were students, 3.5% of respondents were pensioners, while 17.4% of respondents belonged to the other category. 48.6% of the respondents stated that they live in the countryside, 18.8% in the city (wider urban area), while 11.1% of the respondents live in the suburbs and in the city (inner urban area).
67.4% of respondents participate in traffic as drivers, while 23.6% of respondents participate as pedestrians. 79.9% of respondents have a driver's license, while 20.1% do not. 63.9% of respondents have a driver's license for a passenger car, while 9.7% have a driver's license for a truck.
This research analyzed the accuracy of dangerous goods symbols recognition by respondents. Respondents recognized the meaning of the symbol for “toxic materials” with the highest percentage of accuracy (86.11%), and with the lowest percentage of accuracy (40.97%) they recognized the meaning of the symbol for “infectious materials” ( Table 1).
Symbol | The Meaning of Symbol | Correct (%) | False (%) |
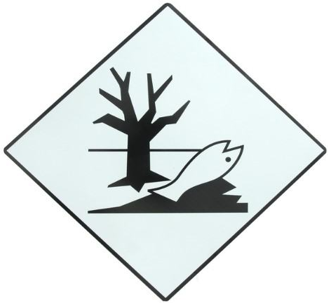 | "Environmentally hazardous materials" | 63.19 | 36.81 |
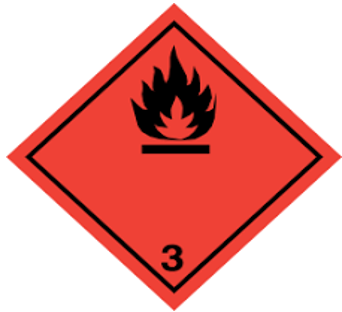 | "Flammable liquids" | 56.25 | 43.75 |
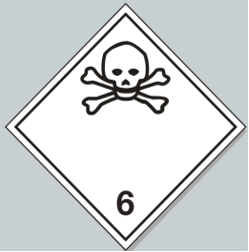 | "Toxic materials" | 86.11 | 13.89 |
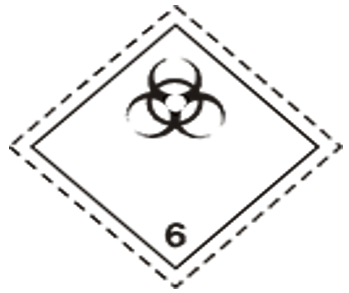 | "Infectious materials" | 40.97 | 59.03 |
 | "Non-flammable, non-toxic gases" | 65.28 | 34.72 |
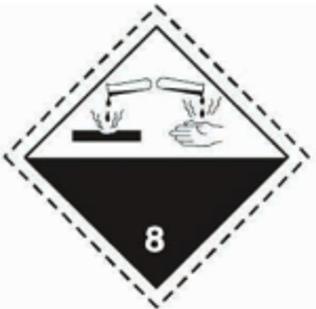 | "Corrosive materials" | 64.58 | 35.42 |
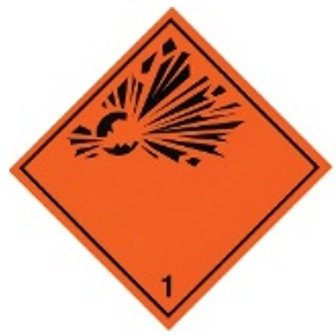 | "Explosive materials or objects" | 66.67 | 33.33 |
When asked whether the multi-compartment tank vehicle that transports motor gasoline (UN 1203) and diesel fuel (UN 1202) is properly labeled and marked, 75.7% of respondents stated that it was ( Figure 1).
On a scale from 1 to 10, the largest percentage of respondents (21.5%) rated the feeling of road safety when they see a multi-compartment tank vehicle in traffic with a score of 10, 20.8% of respondents with a score of 5, while 11.8% of respondents rated it with a score of 1.

Independent samples test was used to examine the respondents' perception, attitudes and knowledge about dangerous goods according to the gender of the respondents. The independent samples test shows significant statistical differences in subjects of different genders and perceptions of the symbol “Corrosive materials” (F=-2.253; P=0.026). Also, significant statistical differences were observed between the gender of the respondents and the correct marking and labeling of the multi-compartment tank vehicle (F=-2.241; P=0.027).
A one-factor analysis (One-way ANOVA) of variance was used to examine the respondents' perception, attitudes and knowledge about dangerous goods according to the age of the respondents. The ANOVA results indicate that there are statistically significant differences between the age of the respondents and the perception of the symbol “Flammable liquid materials” (F=3.474; P=0.005).Corrosive materials” (F=2.561; P=0.030). “Explosive materials or objects” (F=3.522; P=0.005), as well as between the age of the respondent and the correct marking and labeling of the multi-compartment tank vehicle (F=5.029; P $<$ 0.005). Table 2 shows the results of Post Hoc Tests (Tukey) for the respondents' perception, attitudes and knowledge about dangerous goods according to the age of the respondents.
Age | 18-25 | 26-35 | 36-45 | 46-55 | 56-65 | Over 65 years |
18-25 | *Correct marking and labeling of the multi-compartment tank vehicle | *"Explosive materials or objects" | ||||
26-35 | *Correct marking and labeling of the multi-compartment tank vehicle | *"Explosive materials or objects" | ||||
36-45 | *Correct marking and labeling of the multi-compartment tank vehicle | |||||
Over 65 years | *"Explosive materials or objects" | *"Flammable liquids" | *"Flammable liquids" | *"Flammable liquids" |
The results of the One-way ANOVA show a significant statistical difference between the different place of resident and the “Environmentally hazardous materials” symbol (F=5.654; P=0.000). Table 3 shows the results of Post Hoc Tests (Tukey) for the respondents' perception, attitudes and knowledge about dangerous goods according to the respondent’s place of resident.
Place of resident | Village | Countryside | Suburb | City (Inner Urban Area) | City (Wider Urban Area) |
Other | *"Environmentally hazardous materials" | ||||
The results of the one-way ANOVA show significant statistical differences between respondents with different educations and the perception of the “Toxic materials” symbol (F=3.213; P=0.006).Explosive materials and objects” (F=2.959; P=0.010) as well as between the education of the respondents and the correct marking and labeling of the multi-compartment tank vehicle (F=3.231; P=0.005). Table 4 shows the results of Post Hoc Tests (Tukey) for the respondents' perception, attitudes and knowledge about dangerous goods according to the respondent’s education.
Respondents’ Education | Elementary School | High School | Basic Academic Studies | Basic Professional Studies |
Elementary School | *"Explosive materials and objects" | *"Explosive materials and objects" | ||
High School | *Correct marking and labeling of the multi-compartment tank vehicle | |||
Basic Academic Studies | *Correct marking and labeling of the multi-compartment tank vehicle | |||
Basic Professional Studies | *"Toxic materials" | *"Toxic materials" |
The results of the one-way ANOVA show significant statistical differences between the respondents' different occupations and the perception of the “Environmentally hazardous materials” symbol (F=11.756; P $<$ 0.005). “Flammable liquids” (F=7.919; P $<$ 0.005), “Toxic materials” (F=2.718; P=0.047), as well as between different occupations of respondents and “Explosive materials and objects” (F=5.713; P=0.001). Table 5 shows the results of Post Hoc Tests (Tukey) for the respondents' perception, attitudes and knowledge about dangerous goods according to the respondent’s occupation.
Respondents’ Occupation | Employed | Student | Pensioner | Other |
Employed | *"Flammable liquids" | *"Flammable liquids" | ||
Student | *"Flammable liquids" | *"Flammable liquids" | ||
Pensioner | *"Environmentally hazardous materials" | *"Environmentally hazardous materials” | *"Environmentally hazardous materials" | |
*"Explosive materials and “objects" | ||||
Other | *"Explosive materials and objects" | *"Explosive materials and objects" |
Significant statistical differences, using One-way ANOVA, were observed between the participants driver's license category and the symbol “Flammable liquids” (F=2.610; P=0.027) and “Explosive materials and objects” (F=2.585; P=0.029). Also, significant statistical differences were observed between the participants driver's license categories and the correct marking and labeling of the multi-compartment tank vehicle (F=3.010; P=0.013). Statistically significant differences, using Post Hoc Tests (Tukey), were observed between the participants driver's license category for a truck and for a passenger car when it comes to the proper marking and labeling of the multi-compartment tank vehicle, while statistically significant differences were observed between respondents who do not have a driver's license and respondents who possess a driver's license for a passenger car when it comes to the perception of the respondents related to the symbol “Flammable liquids”.
4. Discussion
Transport of goods in a city is a basic prerequisite for meeting the needs of the population [17], [18]. The transport of dangerous goods in urban areas represents a high risk that can result in a dangerous situation and unwanted consequences [19]. The share of dangerous goods in the total amount of transported goods of the European Union is 4% [20]. In Poland, in 2014, 87.5% of dangerous goods were transported by road, while 12.5% were transported by rail [20]. The highest percentage of transported dangerous goods in road traffic was achieved by Cyprus (9% in 2019, 12% in 2020), Belgium (10%, 9%) and Finland (8%, 7%). In contrast, Slovakia, Ireland, Bulgaria, Lithuania and Latvia recorded a share of dangerous goods of less than 2% in 2019; Ireland, Lithuania and Slovakia recorded very small shares in 2020 as well. The largest percentage of dangerous goods in the European Union is transported by inland waterways, rail traffic and road traffic [21], [22].
Traffic accidents involving vehicles transporting dangerous goods are extremely rare, and if road crashes occur, the consequences can have unforeseeable and long-term consequences for people's lives and health, as well as their property and the environment [10]. In Serbia, the country where the research was conducted, on average, about 18 road crashes involving vehicles transporting dangerous goods occur annually [23].
The perception of road users is one of the basic factors for safe and smooth traffic flow. Bearing in mind the small number of studies that dealt with the perception of large danger lists and orange boards for marking transport units, in this paper an analysis was carried out that aimed to determine the differences in the perception of large danger lists and orange boards for marking transport units.
Respondents, when perceiving large danger lists, rely on independent interpretation and reaching a conclusion about the meaning of large danger lists. Therefore, the respondents recognized the meaning of the symbol for “toxic materials” with the highest percentage of accuracy (86.11%), and with the lowest percentage of accuracy (40.97%) they recognized the meaning of the symbol “infectious materials”.
In the country where the research was conducted, road users are often able to see tankers transporting motor gasoline (UN 1203) and diesel fuel (UN 1202), and that is what researcher Maslać [10] pointed out. Therefore, it is not surprising that the respondents in the research in 75.7% of cases correctly perceived a roper marked and labeled multi-compartment tank vehicle that transports motor gasoline (UN 1203) and diesel fuel (UN 1202).
The transport of goods in urban areas is necessary for the daily life and work of the population, but it also carries high risks, especially when it comes to the transport of dangerous goods. Researchers Maslać [10] identified differences in the behavior of drivers transporting different classes of dangerous goods. Specifically, drivers transporting Class 4 hazardous materials exhibit the least aberrant behavior, while drivers transporting Class 9 exhibit the highest aberrant behavior. Given these observed differences, there emerged a need to investigate the perception of symbols on large hazard placards and orange panels by road users, which was also the aim of this study. A survey of the perception of symbols on large danger lists and orange boards for marking transport units reveals differences in interpretation, with the majority of respondents relying on their own interpretation of the symbols. Nevertheless, the majority of road users successfully recognize tankers that transport motor gasoline and diesel fuel, most likely because this is the most common transport of dangerous goods and the symbols are also intuitive. The research results indicate that there are statistically significant differences in the perception of large danger lists and orange boards for marking transport units when observed according to the gender of the participants, their age, place of residence, education, occupation and driver's license category.
5. Conclusions
Based on the data collected and analyzed in the conducted research, the following conclusions can be drawn:
• There are statistically significant differences among respondents of different genders and the perception of symbol “Corrosive materials” (F=-2.253; P=0.026), as well as between the gender of the respondents and the proper marking and labeling of the multi-compartment tank vehicle (F=-2.241; P=0.027);
• There are statistically significant differences between the age of the respondents and the perception of symbols “Flammable liquids” (F=3.474; P=0.005). “Corrosive materials” (F=2.561; P=0.030).Explosive materials and objects” (F=3.522; P=0.005), as well as between the age of the respondent and the proper marking and labeling of the multi-compartment tank vehicle (F=5.029; P $<$ 0.005);
• Significant statistical differences were observed between the respondents' place of resident and the symbol “Environmentally hazardous materials” (F=5.654; P=0.000);
• Significant statistical differences were observed between respondents with different education and perception of symbols “Toxic materials” (F=3.213; P=0.006).Explosive materials and objects” (F=2.959; P=0.010) as well as between the respondent’s education and the proper marking and labeling of the multi-compartment tank vehicle (F=3.231; P=0.005);
• There are significant statistical differences between the respondents' occupations and the perception of symbols. Environmentally hazardous materials” (F=11.756; P $<$ 0.005).Flammable liquids” (F=7.919; P $<$ 0.005). Toxic materials” (F=2.718; P=0.047), as well as between different occupations of respondents and “Explosive materials and objects” (F=5.713; P=0.001);
• Significant statistical differences were observed between the driver's license category of the respondent and the symbol “Flammable liquids” (F=2.610; P=0.027) and “Explosive materials and objects” (F=2.585; P=0.029), as well as between the driver's license category of the respondent and the proper marking and labeling of the multi-compartment tank vehicle (F=3.010; P=0.013).
Based on the collected data, we can conclude that there is a significant variation in the perception of danger lists and the proper marking of tank vehicles among young drivers, depending on gender, age, education, occupation, place of residence and driver's license category. The obtained research results play a significant role in enhancing road safety. Identified statistically significant differences among respondents indicate the need for targeted educational programs and campaigns tailored to specific driver groups. Additionally, the results underscore the need for continuous monitoring and evaluation of the effectiveness of existing safety measures in the transportation of dangerous goods. Future research should deepen the analysis of specific factors that contribute to differences in the perception of danger lists and the proper marking of tank vehicles among young drivers. In addition, the effectiveness of different training and education methods to improve road safety awareness among this population could be investigated and exploring the potential implementation of new technologies, such as digital vehicle marking systems, to enhance the visibility and recognition of vehicles transporting dangerous goods. Also, it is necessary to examine and develop drone transportation [17] of dangerous goods and other goods, as well as the manner of their marking. A limitation of this study may be the limited number of respondents and the specific demographic characteristics of the sample, which may limit the reliability of the results obtained. However, the practical application of these results may include the development of personalized trainings and campaigns aimed at young drivers to increase their awareness and understanding of road safety, thereby reducing the risk of accidents and improving the overall safety of all road users.
The data used to support the research findings are available from the corresponding author upon.
The authors declare that they have no conflicts of interest.