Seismic Performance Comparison of Reinforced Concrete and Steel Frames with Various Bracing Configurations
Abstract:
Earthquakes, characterized by unpredictable seismic events, release substantial lateral energy, which propagates through structures, often causing significant damage before the motion subsides. In the absence of specific seismic design guidelines in the British Standards (BS), the introduction of the Eurocode has provided a more comprehensive framework for seismic resistance. Although Sarawak, Malaysia, is situated in a low seismic hazard zone, the effects of seismic forces on structures that are not explicitly designed for seismic resistance remain poorly understood and under-researched. This study employs SAP2000 software to conduct nonlinear pushover analysis (POA) and nonlinear time history analysis (NTHA) on medium-rise reinforced concrete (RC) and steel frame buildings subjected to lateral forces and dynamic ground motions scaled to the local seismic intensity, in accordance with Eurocode 8 (EC 8). The seismic responses of different structural models, incorporating various bracing configurations, were compared to evaluate the relative performance of each system. The influence of material type and bracing configuration on structural behavior under seismic loading was examined. The results suggest that, among the configurations analyzed, the RC frame with central inverted V-bracing (Model 1) exhibits superior seismic performance in terms of lateral stiffness, displacement control, and energy dissipation, positioning it as the most optimal design solution for the study's conditions. This investigation highlights the critical role of structural design and bracing configuration in enhancing the seismic resilience of buildings, even in regions with relatively low seismic risk.1. Introduction
Since Malaysia's independence in 1957, BS has been widely used in the building industry [1]. However, BS does not provide guidelines for constructing structures to withstand seismic forces [2], [3]. Furthermore, due to the country's geographical location, which classifies it as low seismicity, earthquake-resistant designs for regular buildings, such as low-rise and mid-rise building frames, are not emphasized [4]. The extent of damage caused by earthquakes is determined by factors such as the location of the epicenter, the density of population in the affected area, and secondary events such as fires caused by earthquakes, which contribute indirect damages to the surrounding area [5], [6]. An earthquake is a sort of natural disaster caused by the convergence of tectonic plates beneath the surface of the earth, which brings about ground shaking. An earthquake might occur in every minor vibration on the ground that no one feels, yet major earthquakes can hurt people and knock down buildings [7]. The frequency, size, and kind of seismic that occur in certain locations are referred to as seismicity [8]. Malaysia, while being classified as a low seismicity region, includes areas such as East Malaysia (Sarawak and Sabah) that are closer to active tectonic zones [1]. These regions face elevated seismic risks due to their proximity to the Philippine Mobile Belt and the Sunda Plate. Despite the historically low frequency of major earthquakes, tremors from regional seismic activities (e.g., Sumatra subduction zones) have caused structural vibrations, highlighting vulnerabilities in existing building designs [4].
RC and steel are two commonly utilized construction materials, each with unique properties and advantages [9]. The choice of these materials is frequently influenced by considerations such as the cost of the materials, the accessibility of the materials, and the design requirements [10]. This study investigates and compares various bracing configurations in RC and steel building frames, with the goal of contributing significant information to seismic design techniques. Instead of defining seismic design requirements for concrete structures, BS focuses on gravity loads for building structures. Malaysian authorities have recognized the extent of the earthquake's impact and pushed professional organizations to create a national set of standards for seismic engineering in order to construct future buildings [11]. In 2017, National Annex (NA) of Malaysia to EC 8 was issued. When some essential terms must be followed, it is advisable to employ NA in conjunction with EC 8 [12]. EC 8 and NA cover some Malaysian-specific features such as ground conditions, critical elements or specialized building applications, design earthquake magnitude, and so on [13].
Ductility is a key for seismic design in the context of RC and steel building frames, influencing the overall performance and reactions of structures to ground motion [9]. Understanding and exploiting the ductile behavior of building materials and configurations is crucial for constructing earthquake-resistant designs [10], [14]. This study aims to contribute to this understanding by conducting a comprehensive comparison study of various bracing configurations in RC versus steel building frames, with a particular emphasis on comparing and assessing the ductility characteristics of these structural systems in seismic environments. Engineers' work can be accelerated by design software and structural analysis [15], [16]. Some powerful software can be helpful in analysis while conforming to EC 2 and EC 8 and are recommended by the European Standard Committee. The proposed software was used to design concrete structures and structural designs for earthquake resilience, respectively [17], [18]. SAP2000 software was utilized in this research to design and analyze the building in accordance with EC 2 [19], [20]. This study aims to contribute to continuing efforts to improve structural seismic resilience and to inform best practices in structural design.
In this study, the building structure was simulated using SAP2000 software to explore the behavior of RC and steel building frames with various bracing configurations. To model and evaluate the structures, static nonlinear POA and dynamic NTHA were used. The research aims to give a targeted and relevant addition to the understanding of bracing configurations in seismic design by specifying this scope of study, ensuring that the conclusions are both rigorously researched and practically usable.
2. Literature Review
Medium-rise structures, usually with five to ten stories, make up a large portion of city skylines. They are essential components of the human-made environment, serving institutional, business, and residential functions [21]. Given their extensive use, understanding the knowledge in seismic behavior of these structures in relation to various bracing strategies is vital. Bracing systems offer special methods for enhancing the seismic resistance of medium-rise RC buildings [22]. These systems include chevron bracing, cross bracing, V-bracing, and diagonal bracing [1], [23]. Conducting an analysis of these systems' performance is crucial for making well-informed decisions regarding building design and retrofitting. In the past 30 years, some moderate earthquakes have struck our planet in 5- to 10-year intervals, causing serious damage and suffering to humanity through collapsed structures, tsunamis, floods, and landslides on weak slopes, and liquefaction of sandy soils. The development of new cities in earthquake-prone zones has resulted in huge socioeconomic losses around the world. However, in the past, seismic code rules did not keep up with construction changes. Existing RC structures that were not designed with seismic criteria and ductile features may experience severe damage in ground motion during earthquakes. Horizontal forces caused by wind loads, earthquake loads, and blast loads, among other things, are becoming increasingly important.
SAP2000 was utilized in this study to examine an existing eight-storey RC frame structure building that had been upgraded with concrete shear walls and steel bracing at the building's periphery and core. In terms of base shear, lateral displacement, bending moments, and storey drifts, a comparison of the concrete shear wall and steel bracing was made [1].
Najar and Ahmadi [11] examined the seismic resistance of steel structures outfitted with dissipative columns and conducted a parametric evaluation of column geometry and plate arrangement. Nonlinear dynamic analyses were performed on steel frames of five, ten, and 15 stories equipped with various dampers and subjected to near- and far-field ground motions. The results showed that the damper frames surpass other frame types in respect to power, margin ratio of failure, highest ratio of inter-storey drift, and base shear. In addition, a capacity-based design method for estimating the optimal number of plates was suggested, as well as regression equations for predicting the required damper column height.
To conduct a pushover study, a structure is subjected to a sequence of lateral stresses that increase monotonically. This represents the inertial forces that the structure would encounter during ground shaking. Several structural parts may give way one after the other when the loads increase gradually. As a result, the structure becomes less rigid with each occurrence. A pushover study can be used to identify a typical nonlinear force-displacement relationship [9]. POA is a nonlinear, static technique that gradually raises the magnitude of structural loading in compliance with a predetermined style. As the load grows, weak linkages and structural failure mechanisms are revealed. The loading is considered as monotonic, and the upshot of cyclic behavior and load reversals are computed with a modified monotonic force-deformation criterion and damping approximations. Static POA means the attempt of structural engineers to determine the true strength of a structure and its potential to be a useful and practical tool for performance-based design [2]. As shown in Figure 1, five points assigned as A, B, C, D, and E explain the hinge's force deflection behavior, whereas the points labeled as IO, LS, and CP define the hinge's criteria of acceptance.

Figure 2 below shows that the structure has strong resistance if the demand curve crosses the capacity envelope at the elastic range. As shown in Figure 3, if the demand curve crosses the capacity curve with minimal reserve of strength and deformation capacity, the structure would react badly during the induced seismic excitation and needs to be adapted to avoid future catastrophic damage or collapse [9].


There are four types of time history analysis methods: elastic static, elastic dynamic, nonlinear static, and nonlinear dynamic [8]. Each method of analysis has specific aims and design aspects that govern the findings. As a result, it is crucial to select a suitable approach that meets the design goals. Nonlinear dynamic analysis is absolutely the most realistic and precise approach to analysis available. It is also known as NTHA, the nonlinear response history analysis, or the nonlinear dynamic procedure (NDP) according to ASCE 41-06 (2007). Time history analysis is a computerized modeling method that forecasts the dynamic response of buildings by considering the actual time-dependent loads applied to them. Unlike basic static analysis, which assumes that loads function instantly and remain constant throughout, it considers the changing nature of forces over time. The most difficult aspect is developing the time history curve for the investigation. The analysis requires variations in ground acceleration. This might be built for countries that have appropriate data. Countries without earthquake experience, on the other hand, would have to rely on the curves created by other countries [10].
Time history analysis, on the other hand, has significant benefits over simplified approaches, making it an important method in the design and analysis of structures subjected to dynamic forces [10]. By taking into account the time-dependent nature of loads, time history analysis provides a more meticulous reflection of the actual behaviors of structures. Engineers can better comprehend the dynamic reaction and discover potential weaknesses because of this [10]. From the point of view of safety assessment, dynamic occurrences, such as seismic activity, can pose considerable dangers to structural safety. Engineers can examine a structure's performance under harsh loading circumstances using time history, which helps them ensure its safety and durability [10]. Furthermore, engineers can iteratively update a structure's design to increase its performance over time. They can create an ideal design solution by assessing many scenarios and considering the dynamic reaction [10]. Finally, many building rules and standards include the thoughts of dynamic loads during the design phase. Engineers can use time history analysis to accomplish these requirements and make sure that structures follow applicable legislation [10].
3. Methodology
The methodologies employed in this study assess the seismic performance and sustainability of medium-rise buildings with irregular configurations. The details of a building's seismic performance were determined using static nonlinear POA and dynamic NTHA in this study. The SAP2000 program was used to assess the seismic performance of medium-rise RC and steel building frames in line with the NA to EC 2 and EC 3. When a seismic event occurs, the different types of building configurations demonstrate different ductility of the building and diverse torsion forces applied to the building.
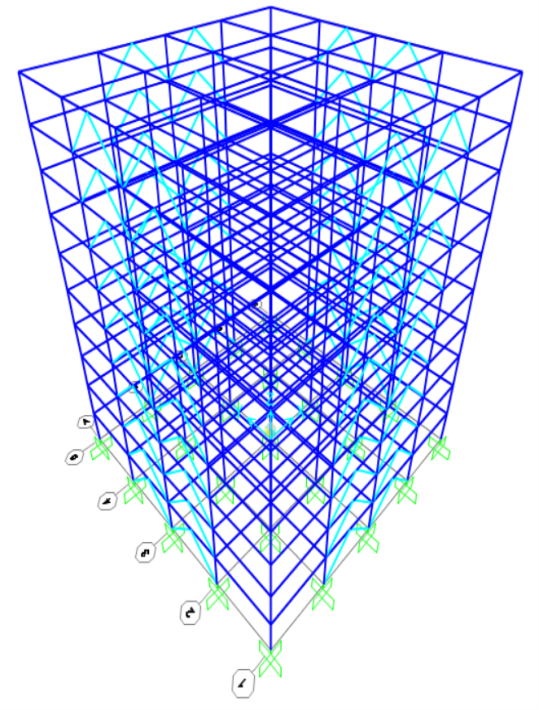
Different types of building models with different bracing configurations were used to prove that they can affect the seismic resistance of medium-rise buildings. Based on Figure 4, the 10-storey (G+9) RC frame building with inverted V-bracing at the center and open space on the ground floor was chosen. This building was modeled by SAP2000 software and the structural frame was designed according to the EC 2. Details of the RC and steel building frame are provided in Table 1 and Table 2, respectively.

Material used for the Building Frame | RC |
Number of stories | 10 (G + 9) |
Dimension of the building frame | Length = 24 m |
Width = 24 m | |
Height = 30 m | |
Concrete grade | C30/37 |
Steel material (reinforcement) | S355 |
Bracing | IPE 400 (inverted V-bracing) |
Joint restraints | Fixed |
Material Used for the Building Frame | Steel |
Number of stories | 10 (G + 9) |
Dimension of the building frame | Length = 24 m |
Width = 24 m | |
Height = 30 m | |
Steel material | S355 |
Bracing | IPE 400 (inverted V-bracing) |
Joint restraints | Fixed |
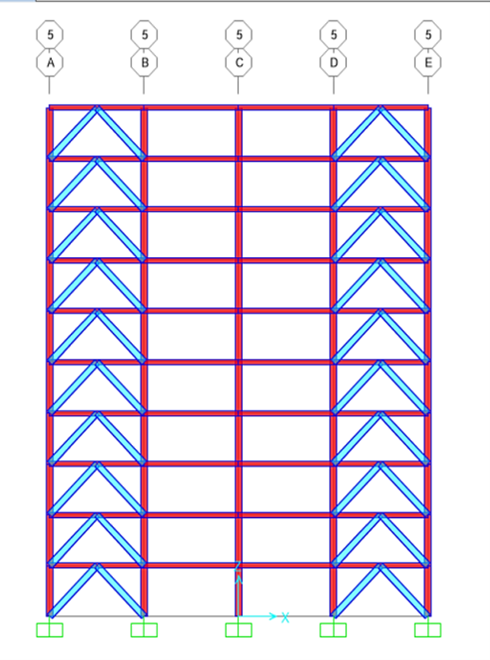
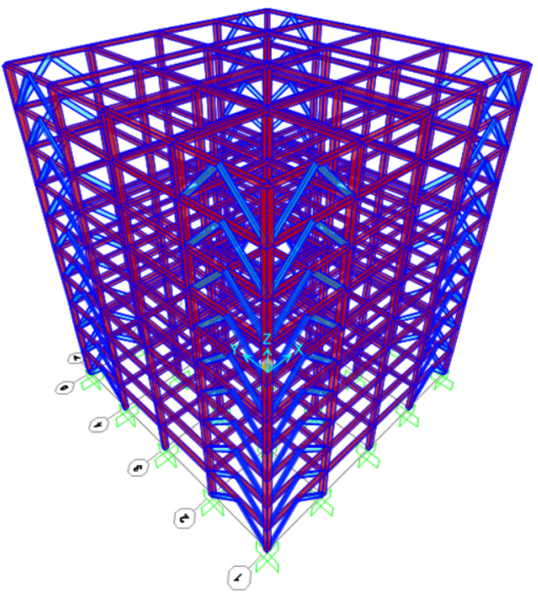
Table 3 shows different types of models from the side view and the 3D view. Static nonlinear POA is one type of method where a building or structure is subjected to gravity loading and the loading increases until the structure obtains failure and damage. Pushover load is imposed at specified joints once the building model and structural member have been determined. The capacity curves are then obtained by conducting the POA. A static pushover curve that graphs a strength-based parameter versus deflection was developed. Figure 5 shows the flow chart of the static nonlinear POA.
Model Type | Side View | 3D View |
RC frame (Model 1) | 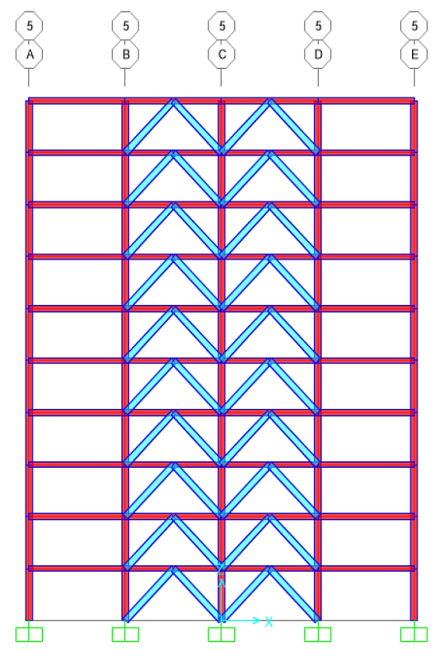 | 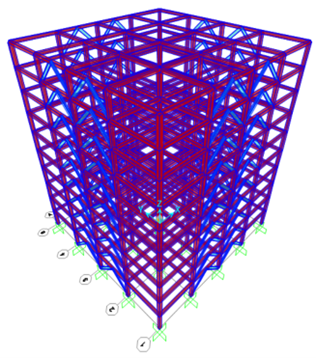
|
RC frame (Model 2) |
 | 
|
Steel frame (Model 1) |
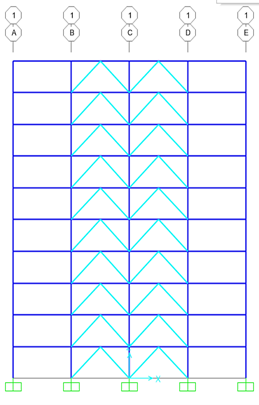 | 
|
Steel frame (Model 2) |
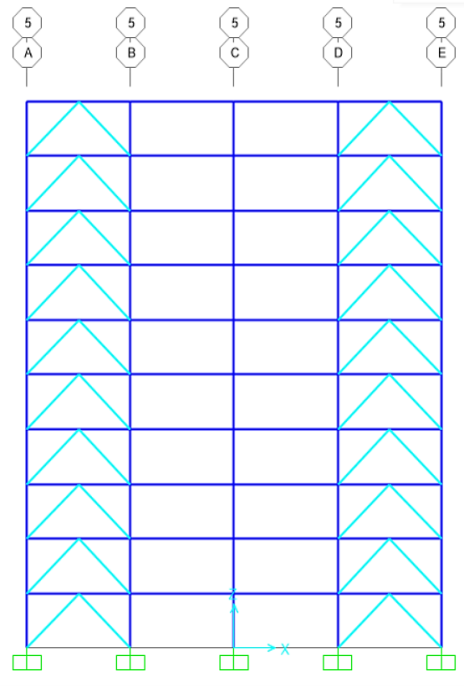 | 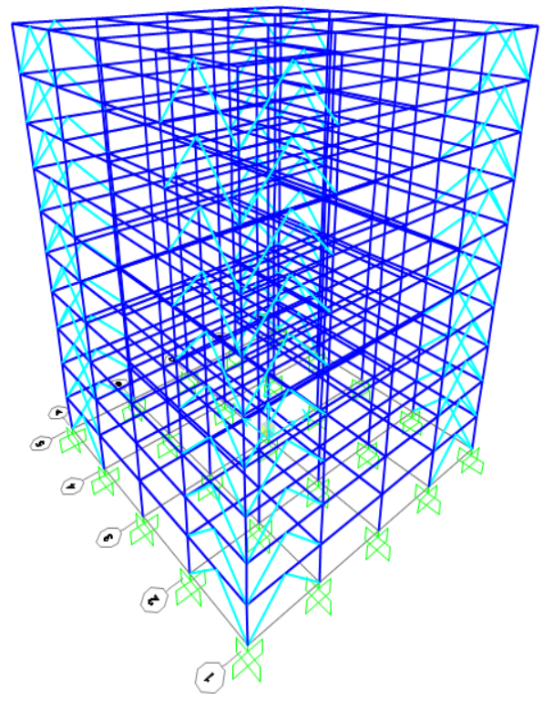 |

Furthermore, NTHA is a method of simulating structural performance and behavior under seismic loads. For this research, the procedures are almost the same as POA. The only different steps are that NTHA needs to determine the ground motion in a specific area and change the case type to the time history. NTHA was applied until achieving the response spectrum curve. Figure 6 shows the flow chart of NTHA.

4. Results and Discussion
POA is the initial way to assess a building's seismic response. When being subjected to POA, each model exhibits a variety of deformed shapes. The goal of observing the deformed shape is to study the behavior of the model when a specific bracing configuration is introduced and applied to it. The behavior of the deformed shape was explained in terms of performance level using the typical force displacement curve. The parameter used to define the shape of horizontal elastic response spectra for Sarawak was adapted from MS-EN-1998-1:2005. The ground type of the models in this research was designated ground type B, as shown in Table 4 below.
Ground Type | S | TS (s) | TC (s) | TD (s) |
A | 1 | 0.05 | 0.5 | 1.2 |
B | 1.2 | 0.15 | 0.5 | 1.2 |
C | 1.3 | 0.2 | 0.5 | 1.2 |
D | 1.35 | 0.2 | 0.5 | 1.2 |
E | 1.4 | 0.15 | 0.5 | 1.2 |
As shown in Figure 7, Model 3 has the least resultant base shear, which is 26253.66 kN, with a displacement of 0.18 m. Model 1 has the largest resultant base shear of 156,966.41 kN and both Model 1 and Model 2 have similar monitored displacements, which are 0.2 m. Model 2 has a lower resultant base shear of 150,000 kN, compared to Model 1, indicating that Model 1 performs better under the seismic stress since it can withstand up to almost 15,700 kN of base shear force while the two models have almost the same displacement value of 0.2 m. Previous research has shown that the addition of steel braces to RC frames, particularly the inverted V-bracing system, can significantly increase their capacity [7]. The building frame with the inverted V-bracing system at the center of the frame can reduce the bending moment with the highest percentage, which means that the inverted V-bracing can minimize the bending moment of the structure effectively [5].

Figure 8 depicts the performance point (Sa, Sd) of a building for each model by analyzing the capacity curve. All the data was collected from the software SAP2000. From Figure 8, most of the demand curves intersect with the capacity curve envelope, indicating that the structures have a decent resistance. It can be observed from Figure 8 that Model 3 and Model 4 have relatively higher spectral acceleration, with the highest point being within the range of 45-55. Model 1 and Model 2 have better performance compared to the other two types of models.

Figure 9 shows the inter-storey drift of each model obtained from the pushover analysis. The inter-storey drift generally decreases upon going up each floor of the building because it is calculated based on a fixed reference point, which is the initial position of the ground floor. Therefore, even as the displacement increases going up the structure, the inter-storey drift decreases as the reference point is the floor below it.
In Figure 9, Model 3 contributes the highest inter-storey drift, which is 0.084 m, while Model 1 has the lowest inter-storey drift of 0.054 m. Based on Figure 9 above, Model 3 has the biggest changes in the inter-storey drift compared to other models because the configuration of Model 3 is not suitable or not applicable. This might be caused by the bracing configuration which is different from that of Model 4.

Time history analysis is the second approach for analyzing the building’s resistance to seismic loads. Time history records from Aydin, Tokat, and Tosya, located in Turkey, were employed in this investigation. Each time history was utilized to conduct NTHA using SAP2000 on the scale of 0.1 g, 0.2 g, 0.3 g, and 0.5 g.
Figure 10 shows the average absolute displacement for each model based on the three seismic records utilized in analyzing the result by SAP2000. According to Figure 10, Model 3 has the maximum displacement which is 0.0324 m. Model 4 has a displacement of about 0.0313 m. Model 1 and Model 2 show a similar absolute displacement, which is 0.0254 m and 0.0257 m, respectively. From the result, it can be concluded that Models 1 and 2 have nearly identical strength and seismic performance. While Models 3 and 4 have nearly identical strength and seismic performance as well. In contrast to the POA, which suggests that Model 1 is less flexible and performs better under seismic load, time history analysis also demonstrates that the performance of Model 1 is better under seismic conditions.

Figure 11 presents the Incremental Dynamic Analysis (IDA) curve illustrating the average inter-storey drift ratio of each storey for all models. It can be observed from the figure that Model 4 has the highest inter-storey drift of 1.195%. Model 1 has 0.955% of the inter-storey drift ratio with better performance compared to Model 2. Model 2 and Model 3 have inter-storey drift ratios of 0.855% and 1.075%, respectively. Figure 11 also shows that for concrete frame models, Model 1 has better performance. While for steel frame models, Model 4 shows better performance.

5. Conclusions
The results of these analyses provide a comprehensive understanding of the performance of four structural model designs under Sarawak’s seismic conditions across varying peak ground acceleration (PGA) levels of 0.1 g, 0.2 g, 0.3 g, and 0.5 g. The structural models were evaluated using two methodologies: static nonlinear POA and dynamic NTHA. For NTHA, the average performance index was derived using three distinct seismic time histories from Aydin, Tokat, and Tosya in Turkey. POA was conducted for ground type B, while NTHA simulations were performed at PGA levels of 0.1 g, 0.2 g, 0.3 g, and 0.5 g. The seismic performance of the four models was assessed in both analyses, highlighting the impact of different bracing configurations and construction materials on the building frame. The findings emphasize the influence of the configuration factor on the seismic resistance of medium-rise buildings, which is a central objective of this research. Based on the results obtained, several key conclusions can be drawn below.
According to POA, Model 1 has the highest resultant base shear with the lowest displacement compared to Model 2 since both models were built up by concrete frames. For Models 3 and 4, which were built by steel frames, Model 4 has a higher resultant base shear, and it shows a lower displacement compared to Model 3. Therefore, Model 1 is the strongest building among all models since it can uphold the highest base shear than other models with the lowest displacement. The ductility value of 8.96 again shows that Model 1 is the most suitable building design. The ductility values of Models 2, 3, and 4 are 7.48, 5.57, and 6.24, respectively. According to NTHA, all the models perform similarly under the recorded design earthquakes in Turkey at various PGA levels of 0.1 g, 0.2 g, 0.3 g, and 0.5 g. Among the four models, Model 3 has the largest absolute displacement of 0.0324 m on average. Models 1 and 2 show the lowest and similar displacement values in average, which are 0.0254 m and 0.0257 m, respectively.
It has been proven that the bracing configuration has a significant impact on the seismic performance of the buildings. Model 1, which is the concrete frame building with inverted V-bracing at the center of the span, leads the other four models with various bracing system designs. The steel bracing system demonstrates practical and cost-effective techniques for RC multi-storey buildings located in high seismic zones. Steel bracing can transfer lateral loads through axial motion. Moreover, concrete frames also offer superior stability, which can be particularly important in mid-rise buildings such as a 10-storey structure. Concrete structures often provide better damping of vibrations, which can enhance the comfort of the building’s occupants.
Conceptualization, Vincent and Azira; software, Vincent, writing—original draft preparation, Vincent and Azira; writing—review and editing, Vincent and Azira.
The data used to support the research findings are available from the corresponding author upon request.
The authors declare no conflict of interest.
