Stability Analysis of Gentle Dip Thick Ore Body Mining Based on the Integration of SURPAC-FLAC3D
Abstract:
Issues of large exposed roof area, poor stability, and significant roof support workload are prevalent in the mining of metal ores with gently inclined thick bodies. In response to these challenges, a downward cemented fill mining method has been proposed to enhance the stability of the surrounding rock and filling body. By integrating SURPAC and FLAC3D software, a three-dimensional numerical model that conforms to the actual geological morphology of the mining area was established. Numerical calculation results indicate that after the first stage of ore body excavation, the surrounding rock settlement mainly occurs in the roof and the hanging wall of the -65m level, with the hanging wall settlement primarily concentrated between the 3rd and 4th vertical exploration lines. The filling body demonstrates a weak compressive stress capacity, leading to a gradual transition of compressive stress to the surrounding rock of the mine stope. As the excavation level increases, the compressive stress on the pillars also increases, forming a compressive stress concentration area at the -65m level. A mixed plastic zone of shear and tension is generated in the roof and hanging wall, while a shear plastic zone is present in the inter-pillar area. The findings of this study offer valuable insights to ensure the safety of mining in gently inclined thick ore bodies.
1. Introduction
China's iron ore output has long been insufficient to meet the demands of the steel industry, resulting in a high dependency on foreign imports, thus seriously constraining sustainable economic development. As shallow mineral resources are limited, the extensive exploitation of deeply buried underground mineral resources has become imperative. The stress environment of rock masses under shallow and deep excavation conditions greatly differs, especially given the diverse hydrogeological environments in different mines, limiting the applicability of existing experiences. Gently inclined thick ore bodies, defined as those with a thickness greater than 15m and a dip angle between 5° and 30°, are widely distributed in China's non-ferrous metal mines [1]. The low dip angle and large thickness of these ore bodies give rise to numerous mining challenges [2], [3], [4], [5], such as difficulty in ore extraction requiring a high degree of mechanization, instability of the roof when mining beneath voids, and high ore mining costs. Therefore, it is necessary to resolve the mining difficulties associated with gently inclined thick ore bodies and increase China's iron ore output.
2. Literature Review
Many scholars have undertaken significant work to address the mining challenges associated with gently inclined thick ore bodies [6], [7], [8], [9], [10], [11], [12], [13], [14]. Luo et al. [8] proposed a deep-hole combined underground ore-waste separation continuous mining method, which resolved the drawbacks of traditional mining methods and enhanced the mining efficiency of gently inclined multi-layer ore bodies. Vasichev [9] employed a combination of filling mining method and caving method for mining gently inclined thick ore bodies, ensuring the stability of rock strata. Li et al. [10] found that surrounding rocks are most prone to shear failure when the dip angle of the ore body is 30°, with the potential tensile failure zone transitioning from the mined-out area to the upper part, and the roof of the deep-mined area evolving from tensile failure to shear failure. Jiang et al. [11] studied the influence of strip filling mining sequence on mining-induced damage and discovered that the 'fill-first, mine-later' method can reduce stress concentration and plastic zone area during the mining process. Sun et al. [12] researched the stress distribution of lateral advanced support under different filling ratios in deep filling faces and found that the larger the filling ratio, the smaller the peak stress and stress concentration coefficient of the lateral advanced support, significantly reducing the surrounding rock pressure. Newman [13] analyzed the stress distribution and overall stability of multiple filled mining areas, thus optimizing the layout of the mining area and the sequence of filling. Jahanbakhshzadeh et al. [14] analyzed the stress changes in inclined fill mining areas through three-dimensional numerical simulation and examined the impact of factors such as ore body dip angle and roadway dimensions on mining area stability.
While the aforementioned studies provide essential guidance for the safe mining of gently inclined thick ore bodies, there is a paucity of research concerning the influence of downward cemented fill mining method on the mining stability of gently inclined thick ore bodies. Furthermore, many simplifications are made in three-dimensional numerical calculation models for mines [15], [16], [17], [18], resulting in significant deviations from the actual geological situation, which compromises the reliability of numerical calculation results. This paper, against the backdrop of a mine with gently inclined thick ore bodies using the downward cemented fill mining method, establishes a three-dimensional geological model that conforms to the actual geological conditions using SURPAC software. After data conversion, the model is imported into FLAC3D to create a three-dimensional numerical model, and the displacement, stress, and plastic zone distribution characteristics of the surrounding rock and filling body during the downward cemented fill mining process are analyzed to guide the safe and efficient mining of gently inclined thick ore bodies.
3. Methodology
The shallow ore body of a certain iron mine has been exhausted, prompting a transition to deeper mining. Given the poorer quality of the rock mass in the deep parts, the mining method was shifted to the downward cemented fill mining method. As shown in Figure 1, the main mining field in the deep part is located at a depth of -50m to -150m, with the red part representing the ore body contour. The ore body is located at the contact zone between the Yanshanian diorite and the Ordovician marble, and is impacted by faults, leading to a relatively complex ore body shape and substantial thickness variation. The blue lines in subgraph (a) of Figure 1 represent different profile numbers. North of profile number 5, the ore body has a northeast orientation with a 31° deviation, and relatively thinner thickness. South of profile number 5, the ore body orientation changes to approximately east-west, with the thickness of the ore body dramatically increasing in certain areas, forming a thick bulged block. The thickness of the ore body gradually increases from profile number 5 towards the south, and expands rapidly at profiles 3 and 4, with the maximum horizontal thickness reaching 148 meters. The average dip angle of the ore body is approximately 30-40°, classifying it as a gently inclined thick ore body. The surrounding rocks of the ore body are mainly marble, altered diorite, silicified diorite, and siliceous rock. These rocks are dense and hard, and exhibit good stability. The roof of the ore body primarily consists of marble and limestone, with local thin-layered siliceous rock, thick and medium-thick layers, and block structures. The floor of the ore body is primarily diorite, with block structures, dense and hard textures, and well-developed joint fractures.

Mining is conducted via a phased downward cemented fill mining method. The phase height of the first stage mining field is 45m, i.e., the ore body from the -50m level to the -95m level is extracted in this stage. Every 100m-150m along the ore body trend is divided into one disk area, with a 15m wide safety pillar reserved at the profile number 5 to strengthen the roof support. The extraction sequence is to mine every other one, with the mine roadway entrance being a rectangular entrance, 5m wide, 5m high, with an entrance length of 50m-75m. The upper and lower roadway entrances are arranged in a staggered pattern along the vein and across the vein. The layout of the mining field is shown in Figure 2.
To analyze the stability of the first stage mining field during downward cemented fill mining, a 3D geological model that conforms to the actual geological shape of the mining area was constructed using SURPAC software and imported into FLAC3D for simulation calculations. According to the ore body range of the core mining area and Saint-Venant's Principle, the model size was determined as X×Y×Z = 520m×460m×198m, with the top horizontal elevation of the model at 5m, 171m below the ground surface. The model's surrounding and bottom are fixed boundaries, with a self-weight load of 2.92MPa applied to the top of the model.
Using the SURPAC geological modeling software, the distribution of various lithologies and irregular rock bodies in three dimensions can be accurately presented [19], [20], [21]. By collecting geological drilling data from the mining area, a geological database was established in SURPAC software, with section interpretation performed in conjunction with exploration profile maps. Based on the section interpretation, solid models and block models of the ore and rocks were constructed. The block model unit size is 2.5m×2.5m×5m. By establishing different constraints, attributes of the ore and rocks were assigned. The final block model is shown in Figure 3, where the brown part on the upper side of Figure 3 is the ground surface model of the mining area, the red ore body part penetrates the block model, the blue part of the block model is marble, and the green part of the block model is diorite. The established block model is located between lines 27 and 41, at a depth of 5m to -200m.
The built-in hexahedral mesh (brick unit) in FLAC3D can be combined into various hexahedral mesh solid units. The brick unit corresponds to the SURPAC block unit, as shown in Table 1.
By comparing the data relationship between the hexahedral unit and the brick unit in Table 1, the centroid coordinate of the SURPAC unit can be converted into the node coordinate of the $\mathrm{FLAC}_{3 \mathrm{D}}$ grid unit, and the data conversion relationship is shown in Eq. (1).
A conversion interface program was formulated using Python, which allowed for the direct export of the centroid data file of the block model from the SURPAC software. This data was then converted into code recognized by FLAC3D, and upon importing this code into FLAC3D, a three-dimensional numerical model was automatically generated. The constructed FLAC3D numerical computation model is depicted in Figure 4. The model consists of a total of 802,016 units and 944,209 nodes. Figure 5 showcases a comparison between the profile of the #2 vertical exploration line and the corresponding profile of the numerical model. Upon comparison, it was found that the constructed numerical model essentially conforms to the real geological conditions.
Unit type | Unit data | Remarks | |
SURPAC | FLAC3D | ||
Hexahedron | 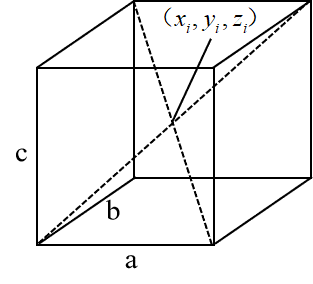 | 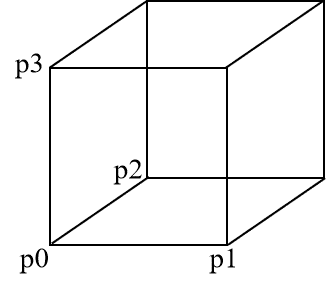 | Brick unit |
A reasonable model is key to ensuring the reliability of numerical simulation calculations, and the setting and selection of basic conditions for simulation calculations also influence its reliability to a certain extent [22], [23].
(1) Physical and mechanical properties of the ore. Based on onsite sampling and laboratory tests, the physical and mechanical parameters of the ore for this simulation calculation are shown in Table 2.
(2) The strength criterion uses the Mohr-Coulomb yield criterion:
Rock Type | Compressive Strength /MPa | Tensile Strength /MPa | Elastic Modulus /GPa | Poisson's Ratio | Bulk Density /kN/m3 | Internal Friction Angle /° | Cohesion /MPa |
Ore | 39.17 | 3.92 | 9.9 | 0.22 | 35.5 | 29.1 | 0.11 |
Dolomite | 63.55 | 4.63 | 13.2 | 0.28 | 27.4 | 42.9 | 0.96 |
Diorite | 121.73 | 10.8 | 30.0 | 0.19 | 26.1 | 48.0 | 2.10 |
Siliceous Skarn | 12.43 | 0.64 | 2.6 | 0.31 | 24.3 | 33 | 1.57 |
Backfill | 3.5 | 0.16 | 0.80 | 0.30 | 18.0 | 15.0 | 0.26 |
In the formula, ${{\sigma }_{1}}$ is the maximum principal stress, ${{\sigma }_{3}}$ is the minimum principal stress, C is the cohesion, $\phi $ is the internal friction angle.
(3) The simulation of the mining sequence follows the actual mining plan, which is from top to bottom, skipping one and mining one in sequence. The backfill strength is 3.5MPa, and the upper and lower roadways are arranged in a vertically staggered manner. The specific simulation mining sequence is shown in Table 3 and Figure 6.
| Step | Specific Description |
| 1 | Initial geostress calculation |
| 2 | Excavation of -55m horizontal step 1 stope |
| 3 | Backfill of -55m horizontal step 1 stope |
| 4 | Excavation of -55m horizontal step 2 stope |
| 5 | Backfill of -55m horizontal step 2 stope |
| 6 | Excavation of -60m horizontal step 1 stope |
| 7 | Backfill of -60m horizontal step 1 stope |
| 8 | Excavation of -60m horizontal step 2 stope |
| ... | ... ... |
| 31 | Excavation of -90m horizontal step 1 stope |
| 32 | Backfill of -90m horizontal step 1 stope |
| 33 | Excavation of -90m horizontal step 2 stope |
| 34 | Backfill of -90m horizontal step 2 stope |
| 35 | Excavation of -95m horizontal step 1 stope |
| 36 | Backfill of -95m horizontal step 1 stope |
| 37 | Excavation of -95m horizontal step 2 stope |
4. Stability Analysis of Stope in Mining Area
Figure 7 presents a cloud diagram of the displacement variation in the surrounding rock when the ore body at different horizontal levels in Section #2 is excavated and backfilled. After the excavation of the ore body at the horizontal levels from -55m to -95m, an increase is observed in the settlement of the roof of the mine room, extending in an arched trend upward, with the maximum value appearing at the roof of the mine room, measured at 35.83mm. When the ore body at the -60m level is excavated, the overlying roof exhibits a settlement, expanding upward in an arched fashion, with the maximum settlement value being 8.43mm. As the excavation depth increases, the area of the settlement zone expands gradually, extending into the hanging wall surrounding rock (the positions of the hanging wall and footwall surrounding rocks are shown in subgraph (a) of Figure 6. After the excavation at the -95m level, the roof settlement peak is 35.82mm, and the backfill above the -60m level undergoes a significant settlement influenced by the roof settlement deformation, with the maximum settlement value being 32mm, while the settlement of the -60m level backfill is smaller, only 17mm.
(1) Displacement
Figure 8 presents a relationship diagram of the roof and ore body position, where the red section represents the dolomite roof directly above the ore body. The lowest elevation of the roof is -50m, and the highest elevation is 5m, with a thickness of 55m. During the excavation and backfilling of the ore body at different levels, the displacement of the roof is affected. To this end, a sectional method is employed to analyze the variation pattern and influence range of the roof displacement.
Figure 9 illustrates the changing trend of the relationship diagram between the roof settlement and the excavation level. As the excavation of the ore body at different levels proceeds, the roof settlement increases linearly without significant displacement mutation.
Figure 10 exhibits a cloud diagram of the roof settlement at the -50m level after the ore body at different levels is excavated. After the excavation at the -60m level, the roof settlement is mainly divided into two areas, namely, the upper roof of the #3 disc area and the upper roof of the #8 disc area, with a smaller settlement above the pillar between the disc areas. As the excavation level increases, the roof settlement increases gradually, the pillar roof settlement between the disc areas increases, but it is less than the settlement of the roofs above the #3 and #8 disc areas, with the #3 disc area roof settlement consistently larger than the #8 disc area roof settlement.
Because the ore body is a tilted ore body, the excavation of the ore body will inevitably affect the exposed surrounding rock in the upper panel. For this reason, the influence of the excavation of the ore body on the surrounding rock in the upper panel is studied through the settlement results of different horizontal sections of the surrounding rock in the upper panel. Figure 11 shows the positional relationship of the surrounding rock in the upper panel. The blue part is the surrounding rock in the upper panel, the perspective part is the surrounding rock in the lower panel, and the colored part in subgraph (b) of Figure 11 is the first stage ore body.
Using the method of layered cross-section, starting from the horizontal -55m, a cross-section is made every 5m downwards, and the maximum settlement value of the surrounding rock in the upper panel is statistically plotted as a line chart, as shown in Figure 12. When mining the ore body above the excavation level -75m, the displacement increase of the surrounding rock in the upper panel at the -55m level is relatively large, and the displacement of the surrounding rock in the upper panel at this level is the maximum. As the excavation level increases, the displacement increase of the surrounding rock in the upper panel at the -55m level decreases and tends to stabilize, and the settlement of the surrounding rock in the upper panel is transferred to the -65m level. After mining the -95m level ore body, the maximum displacement of the surrounding rock in the upper panel at the -65m level is 35.49mm. Overall, the excavation of the ore body at different levels has a greater impact on the surrounding rock in the upper panel within a range of 10m of this layer of mine room.
(2) Stress
Figure 13 presents the cloud diagram for the changes in minimum principal stress with different horizontal excavations in Section #2. After the first floor of the mine room is excavated, stress concentration occurs at the two corners of the mine room, with a stress value of 8.86 MPa. The stress in the roof and floor of the mine room is released, with stress reduction zones appearing. The height of the stress reduction zone is 22m, and the roof stress within a range of 6m above the backfill is only 11.5 MPa. After the stress reduction zone develops upward to a certain extent, a stress arch is formed, with the stress value in the stress arch being 33.5 MPa. The backfill is compressed, and after the second step of advancement, the stress on the backfill is less than that after the first step. As the depth of excavation of the ore body increases, the area of the stress reduction zone in the roof and hanging wall gradually increases. After the last horizontal -95m of the ore body is excavated, stress concentration only occurs in the upper right corner of the mine room, and the stress value increases to 11.23 MPa. The depth of the stress reduction zone on the roof develops upward from 19m to 37m, and the roof stress within a 14m range near the backfill is less than 1 MPa. The backfill in the mine room is generally under low-stress compression, with compressive stress ranging between 0.35 and 0.5 MPa.
Figure 14 is a cloud diagram of stress changes at the -65m horizontal cross-section during the excavation of ore bodies at different horizontal levels. When the ore body at the upper part of the -65m horizontal is excavated, it has a significant impact on the -65m level. The main manifestation is the release of stress in the upper stope, resulting in a stress reduction zone, with the stress concentration around the mine room. The highest stress value is 10.97 MPa. After the excavation of the -65m level ore body, stress redistributes. A closed stress concentration area forms around the mine room, with values ranging from 6 to 7 MPa. The pillar near the footwall concentrates stress, reaching a value of 13.06 MPa. As the lower part of the ore body is excavated, the stress reduction zone in the hanging wall of the -65m level mine room gradually extends deeper. After the excavation of the -95m level ore body, the stress reduction zone in the hanging wall extends upward to a depth of 15m, and a 40m deep stress reduction zone occurs in the upper left corner of the mine room along the direction of #2 vertical survey line. The pillar stress value near the hanging wall reduces slightly, but the overall remains stable between 6 and 8 MPa. The stress value in the stress concentration area near the footwall increases to 16.64 MPa, an increase of 51%.
(3) Plastic Zone
Figure 15 is a cloud diagram of the plastic zone changes of the surrounding rock and filling body at different horizontal excavation levels in Section #2. At the beginning of mining, the plastic zone extends obliquely downwards at the two corners of the stope, with the main form of plasticity being shear destruction; a tensile destructive plastic zone appears within the range of 10m upwards in the roof, and tensile and shear compound destruction occurs in all the filling bodies within the stope. After mining to the -75m horizontal ore body, the plastic zone develops downwards along the dip angle of the ore body at the lower left corner of the stope, with shear destruction as the main form. The roof plastic zone mainly characterized by tensile destruction extends upwards to a range of 20m, and different degrees of tensile destruction plastic zones also occur in the upper rock formation in contact with the filling body within the range of 10m upwards. Part of the filling body filled in the second step of the excavation layer remains in an elastic state, and the filling bodies in the first step of the road have undergone shear and tensile destruction. After mining the -95m horizontal ore body, the plastic zone at the lower left corner of the stope continues to extend downward along the dip direction of the ore body, the range of the plastic zone mainly characterized by tensile destruction in the roof and upper rock extends upward to a range of 25 meters, and some tensile destruction occurs in the lower rock, but the depth of the plastic zone is only 5m. All filling bodies have undergone tensile and shear compound destruction.
The development contour of the plastic zone on the vertical exploration section is shown in Figure 16. With the increase of mining level, the plastic zones of the roof and inclined upper rock gradually develop into the depth in an arch shape, while the lower rock only produces a small amount of plastic zone, and the depth of roof plastic zone development increases more than the inclined upper rock. After mining the -95m horizontal ore body, the development height of the roof plastic zone is 25m, the development height of the inclined upper rock plastic zone at the -65m level is about 15m, the depth of the upper rock plastic zone development at the -75m to -95m level is smaller; mining the lower part of the excavation layer will also be affected by stress release, producing plastic zone and developing downward with excavation.
Figure 17 is a diagram of the relationship between the height of the plastic zone and the excavation level at different horizontal excavation levels on Section #2 of the vertical exploration line. The development height of the roof plastic zone develops stepwise upwards, and after mining the -95m horizontal ore body, the plastic zone develops to the -25m level; the development depth of the floor plastic zone increases linearly with the increase of excavation level, and the influence depth relative to the floor is about 45m.
5. Conclusion
(1) Utilizing SURPAC software, a geological database for a certain Iron Mine was established and a three-dimensional geological model of iron ore that is close to reality was constructed. By developing a PYTHON program, the block unit data conversion between SURPAC software and FLAC3D software was realized, successfully converting the complex geological model into a FLAC3D numerical computation model, thus enhancing the reliability of numerical calculations.
(2) In the initial stage of the first phase of mining, the main settling of the surrounding rock occurs at the roof. With the increase of the downward excavation level, the subsidence of the roof slows down, and the maximum subsidence extends to the upper surrounding rock at a horizontal level of -65m. The settlement of the upper surrounding rock mainly concentrates between the #2 and #4 vertical exploration lines, with a subsidence influence range of 28m.
(3) After the ore body is replaced with a filling body of lower strength, a stress reduction area forms in the stope and the upper and lower surrounding rocks. Stress concentration occurs at the two corners of the stope, with the stress originally borne by the ore body gradually transferred to the peripheral surrounding rock. With the increase of excavation level, stress reduction areas form on the upper surrounding rock at different levels along the #2 vertical exploration line on the left wing of the ore body. A stress concentration area occurs on the pillars between the panels, reaching a maximum value of 13.06MPa.
(4) Within a certain range, shear and tensile mixed plastic zones form on the roof of the stope and the upper surrounding rock and gradually develop upwards with the increase of excavation level, with a height of 30m. Shear plastic zones form downward on the floor, affecting a depth of approximately 50m. Tensile and shear mixed destruction occurs in the upper surrounding rock of the stope, shear plastic zones form on the pillars between panels, and the plastic zone does not extend to the peripheral surrounding rock.
The data used to support the findings of this study are available from the corresponding author upon request.
The authors declare that they have no conflicts of interest.